Executive Summary
Australian construction is under a rare combination of pressures. A record project pipeline, a persistent workforce shortage and productivity that has been sliding for the better part of a decade are converging at once. In response, the sector is digitising faster than at any point in its history. Data analytics, cloud-based project management, mobile field tools and artificial intelligence have all moved from pilot programmes into everyday use on Australian sites and in their back offices.
A closer look at the evidence, however, reveals a more complicated story. Adoption of digital tools is rising sharply, but only a small minority of firms have converted that adoption into genuine organisational capability. Productivity, the metric digitalisation is meant to fix, is still falling. Australian leaders report adopting artificial intelligence at scale at nearly twice the global rate, yet much of that adoption remains disconnected from measurable value. A workforce shortage that stands at about 141,000 today and is projected to reach about 300,000 by mid-2027, meanwhile, is being asked to absorb an entirely new layer of digital and data skills at the same time.
The report examines what is driving these trends and why the gap between buying technology and its effective usage has proven so difficult to close. We will also look at what it means for how construction firms compete, win work and are perceived by the market. It closes with five questions every construction leader should be able to answer about their own organisation, because the industry’s next phase of competition will be decided less by who adopts technology first and more by who converts it into capability the market can actually see.
Australia’s Construction Moment
By any measure available in 2026, Australian construction finds itself inside a boom it did not entirely choose. Housing targets, an electricity grid being rebuilt from the ground up, a hospital construction wave, a defence build-up and a fast-approaching Olympic Games in Brisbane are all drawing on the same pool of concrete, steel and skilled trades at the same time. Demand has arrived suddenly, from multiple directions at once, and three numbers frame the scale of what the sector is now being asked to deliver.
A $242 billion five-year pipeline of major public infrastructure, the largest since Infrastructure Australia began tracking it, spanning transport, energy transmission, health and housing.1
An infrastructure workforce of roughly 204,000 people against a shortage forecast to exceed 300,000 by mid-2027.1
A national housing effort that has now missed its delivery pace for two straight years running, even as total construction activity holds near $82–$83 billion a quarter, up 2.7% on a year earlier.34
A Pipeline Without Precedent
Infrastructure Australia’s 2025 Infrastructure Market Capacity Report puts the five-year Major Public Infrastructure Pipeline at $242 billion for 2024–25 to 2028–29, up 14% on the $213 billion projected a year earlier.1 Zoom out and that figure lands inside a $1.14 trillion five-year construction market once private building, housing and resources projects are counted, with the $242 billion pipeline making up 22% of it and all public spending, including smaller capital projects, 28%.1
Transport still dominates the public pipeline at $129 billion, or 53% of the total, but the more revealing shift is happening elsewhere. Utilities investment, driven almost entirely by new electricity transmission projects feeding the renewable energy transition, has more than doubled to $36 billion in a single year. Buildings spending has climbed to $77 billion, led by social and affordable housing and by hospitals.1 Governments are redirecting money towards the grid and towards housing at a pace the construction market has not previously been asked to absorb.
Housing captures the strain most clearly. National Cabinet’s target of 1.2 million new homes by mid-2029 was meant to be the mechanism that fixed Australia’s affordability crisis. Master Builders Australia’s most recent tracking instead shows the industry has now missed the Accord’s required pace for two consecutive years, with 47,750 fewer homes approved over the past financial year than the trajectory demanded.4 Every trade that shortfall depends on, framers, electricians, concreters, is also being asked to help deliver the $242 billion public pipeline sitting above it.
The Workforce That Isn’t There
The binding constraint underneath all of this is the availability of workers. Infrastructure Australia counted roughly 204,000 workers engaged in infrastructure delivery as of October 2025, against a shortage it currently estimates at 141,000.1 That gap is projected to widen sharply, peaking above 300,000 workers by mid-2027 as renewable energy projects move from planning into construction. Regional Australia carries the worst of it. Shortages outside the capital cities are forecast to grow from around 38,000 workers to 181,000 within two years, concentrated in the same handful of regions now hosting the bulk of the transmission and housing build.1
Adam Copp, Infrastructure Australia’s Chief Executive, was blunt about the trade-off at the report’s launch, saying “we need to make sure we have the people to do the job.”2 The remark lands harder against the report’s own regional figures, which show towns hosting billions in new investment and facing a real risk that there simply won’t be enough hands to deliver it.
Structural features of how Australian construction is organised make the shortage harder to absorb than the raw numbers suggest. Subcontracting now accounts for 41% of infrastructure construction, meaning more than $100 billion of the current public pipeline will be delivered by firms sitting beneath the principal contractor rather than by that contractor directly.1 Most of the industry values subcontracting for the flexibility it offers when workloads swing, but it also multiplies coordination points, dilutes on-the-job training and erodes the self-performance capability that head contractors rely on to sequence complex projects. Layer a workforce shortage on top of a delivery model that is already fragmented, and small delays compound quickly into large ones. It is little surprise that around 60% of firms surveyed by Infrastructure Australia in 2025 named labour and skills shortages a major or significant risk to project delivery.1
Too Many Booms, One Talent Pool
The workforce problem intensifies well beyond construction’s own competition for talent. Australia’s data centre construction wave, driven by AI infrastructure investment, is now pulling directly on the same electricians, mechanical technicians and HVAC specialists that housing and energy projects depend on. Turner & Townsend’s Global Construction Market Intelligence 2026 report found mechanical, electrical and plumbing trade shortages in 83% of Australian and New Zealand regional markets, with Brisbane’s construction costs forecast to rise 7.2% in 2026, the highest of any city in the region, as Olympic preparation, hospital construction and data centre projects compete for the same crews.5
Tiffany Emmett, the firm’s head of construction economics for Australia and New Zealand, said, “Demand is increasingly uneven and concentrated on AI-driven sectors like data centres.”5
Housing, energy transmission, hospitals, defence and data centres now draw from a single, shared labour pool, and every project that wins a crew is a project some other client does not get. A residential builder in outer Brisbane pays whatever wage the data centre down the road is willing to offer, on margins the data centre’s client can absorb far more easily than the builder can.
None of this reduces to a simple story about too little demand meeting too much supply. The real constraint is capacity, whether the market, as currently resourced, organised and skilled, can deliver everything currently being asked of it inside the same five years. Capacity, in other words, is the lens through which every digitalisation statistic in this report should be read. An industry unable to recruit its way out of a shortage this large has an unusually strong incentive to find its productivity gains elsewhere, which is exactly where the next section goes.
Digital Adoption Is Accelerating
Faced with a labour shortfall too large to fill through recruitment alone, Australian construction has spent the past three years reaching for technology instead. What began as scattered experimentation among a handful of larger, better-resourced contractors has become closer to standard practice across the sector. Cloud platforms, mobile field applications, data analytics and artificial intelligence have all moved out of pilot programmes and into daily use, and Australia now sits among the more digitally advanced construction markets in the Asia-Pacific region rather than trailing behind it.
From Pilot to Practice
The clearest evidence of that shift sits in how quickly the numbers have moved. When Deloitte Access Economics and Autodesk first surveyed the region’s construction and engineering businesses in 2023, Building Information Modelling led adoption at 40%, cloud-based project management software sat at 39%, and data analytics and mobile apps each stood at around a third of businesses.6 Artificial intelligence and machine learning barely registered, used by roughly a quarter of firms. Three years on, the fourth edition of the same survey, covering 954 businesses across six Asia-Pacific markets, including Australia, found data analytics used by 56% of businesses, cloud-based project management by 50%, mobile field applications by 47%, and AI or machine learning tools by 46%, nearly double the 2023 figure.7
The pace at which these changes are coming into effect is more alarming than the numbers themselves. A technology used by roughly a quarter of businesses three years ago is now used by close to half. Construction has traditionally lagged manufacturing, retail and financial services in adopting new technology, and that gap is closing fast. What once separated the most advanced contractors from everyone else is now becoming the baseline.
Built Into the Rules of the Game
Some of that acceleration has come from choice, and some of it has been engineered directly into how public work is procured. New South Wales requires digital engineering practices, including BIM, on its major infrastructure projects through the Transport for NSW Digital Engineering Framework, applied to programmes including Sydney Metro. Queensland now mandates BIM from the early planning stage on all state government infrastructure projects valued above $50 million, and Victoria’s Digital Asset Strategy sets equivalent expectations for major public works such as the Level Crossing Removal Project.89 None of these frameworks compel private developers or smaller contractors to adopt digital delivery. However, they set a floor for anyone bidding on the work that sits above it, and that floor rises a little further each year.
The effect resembles what happened when workplace safety requirements moved from best practice to legal obligation a generation ago. Once government clients require it on the biggest, most prestigious projects, the rest of the supply chain has to build the same capability just to stay eligible to bid. The Australian Government’s Building 4.0 Cooperative Research Centre, established to accelerate this shift through industry and university collaboration, is a further sign that governments increasingly treat digitalisation in construction as public infrastructure policy in its own right.10
Where Australia Actually Stands
Zooming in from the regional picture to Australia specifically sharpens the story further. Autodesk and Deloitte’s 2026 survey included 287 Australian businesses and found that 48% of Australian construction employees use construction-specific technology on a weekly basis, the second-highest rate of any market surveyed, behind only Vietnam.11 Australian businesses reported using an average of 7.6 digital technologies each, up from 6.9 in the 2025 edition and 5.0 the year before that, a rate of expansion that has outpaced the regional average.1112 The most widely used tools were construction management cloud software, at 60% of businesses, followed by construction wearables at 53% and AI or machine learning tools at 52%.11
Technology spending has grown alongside usage. Australian construction businesses now direct around 25% of total expenditure towards technology, up from 19% just two years earlier.12 David Rumbens, a Partner at Deloitte Access Economics, linked the trend directly to the cost and delivery pressures described in the previous section, noting that rising input costs are squeezing margins and contributing to a wave of construction insolvencies. Lifting productivity through technology is critical, he argued, warning that without a step change, the industry risks falling further behind national housing targets and further delaying major infrastructure projects.11
Rumbens’ observation is significant. The businesses increasing technology spending fastest are not the ones with room to experiment. They are the ones under the greatest financial strain, treating digital investment as a defensive move as much as an ambitious one. Competing on cost and headcount alone, inside a labour market this tight, is no longer a viable strategy by itself.
The adoption numbers in this section still leave a harder question unanswered, whether buying and installing digital tools is the same thing as using them well enough to change how a project actually gets delivered. We will now look at the gap between adoption and genuine capability.
Adoption Is Not Transformation
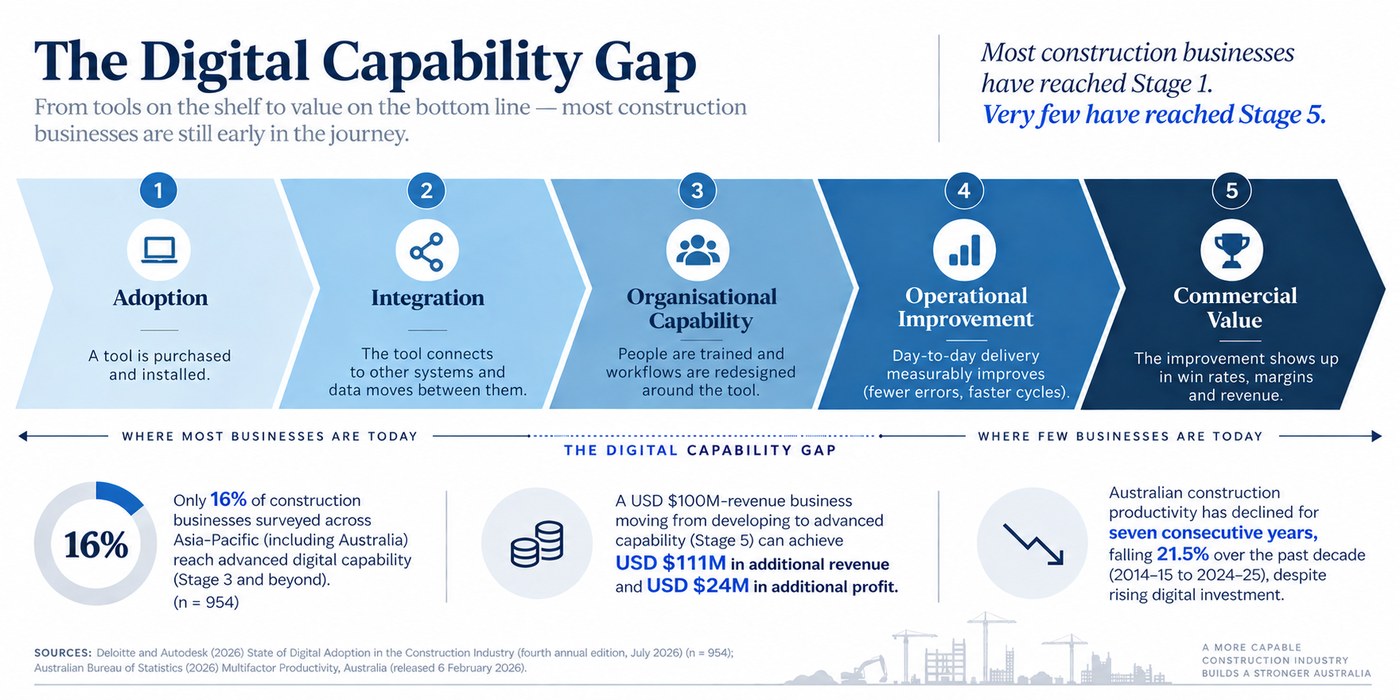
Deloitte and Autodesk built a way to answer that closing question directly. Their fourth annual State of Digital Adoption survey introduces a Digital Capability Index. It scores nearly a thousand construction and engineering businesses across Asia-Pacific. The score reflects how deeply digital tools have taken root in daily operations, not how many a business has bought. The results reshape the story the adoption numbers alone seemed to be telling.
Where the Capability Index Draws the Line
The index measures a business across four dimensions, and a business needs to score well on all four to count as advanced.
Strategy and organisation, whether digital investment is planned and directed by leadership rather than left to individual project teams
Tools and solutions, the actual software and platforms in use
Data and infrastructure, whether systems talk to each other and information moves cleanly between them
Workforce and skills, whether people can use what has been bought with confidence
Only 16% of the businesses surveyed reached advanced capability across all four. Most sit in the intermediate or developing bands instead, and workforce and skills came back as the weakest of the four by a clear margin.11 A business can roll out sophisticated software and still fall short of advanced status because the people using it were never given the training or the workflow changes needed to get value from it.
Two further data points from the same survey make the gap concrete. About a quarter of businesses still rely mainly on paper-based systems in the field, and fewer than half say their on-site teams can reliably access project data in real time.11 Fragmentation is easing. The median number of separate software systems in use per business has fallen from eleven a year ago to six now, a sign that businesses are starting to consolidate rather than keep stacking new tools on top of old ones.11 The trend is early, and consolidation on its own does not mean the underlying data or workflows have caught up with it.
A cloud platform sitting on a company’s server works a lot like the scaffolding wrapped around a half-finished tower. It is essential to how the work gets done, and nobody mistakes it for the building. Tools create the conditions for capability. Building the capability itself, training people, redesigning workflows and connecting systems to each other, is a separate and much slower undertaking, and it is the one most businesses in the survey have not yet finished.
What Advanced Capability Is Actually Worth
The businesses that do reach advanced capability are not simply better organised for its own sake. Deloitte’s data links the score directly to commercial outcomes. Advanced businesses deliver more of their projects on time and on budget, win a higher share of the proposals they bid on, and generate more revenue and profit per employee than developing or intermediate businesses.11 For a business generating USD $100 million in revenue, moving from developing to advanced capability is associated with an additional USD $111 million in revenue and USD $24 million in profit each year.11
The number is large enough to change how a construction business should think about a digital budget. Money spent on tools has usually been justified as an efficiency measure, a way to shave hours off a task or cut rework on site. Deloitte’s figures suggest the bigger prize sits elsewhere, in the tender room. Sumit Oberoi, Autodesk’s Senior Manager for Construction Strategy and Partnerships in the region, put it plainly: “The winners won’t be the firms with the most tools, but the ones that connect workflows, trust their data, and scale what works across every project.”14 A business that can point to real digital capability, not just a list of software licences, is starting to win more work and win it on better terms. In a market already stretched by the workforce shortage and margin pressure described earlier in this report, that difference is no longer a nice-to-have.
The Productivity Number That Refuses to Move
The productivity figures the industry is actually measured against haven’t picked up any of it yet. The Australian Bureau of Statistics recorded a 2.8% fall in construction multifactor productivity for 2024–25, alongside a 2.9% fall in labour productivity, continuing a decline that has now stretched across several years.13 Infrastructure Australia’s own assessment is similarly blunt, describing long-term construction productivity as stagnant and well below historical benchmarks.1 Master Builders Australia counts seven consecutive years of decline, leaving productivity 21.5% below its level just over a decade ago, based on the February 2026 ABS release.25 Modern methods of construction, prefabrication and offsite manufacturing, among them, still account for less than 5% of the market, despite years of encouragement from government and industry bodies alike.1
Digital spending is rising, adoption is rising, and the productivity metric all of that spending is meant to move is still falling, which is the paradox this report set out to examine. The Capability Index goes some way towards explaining it. A business using software without the strategy, the data infrastructure or the trained workforce behind it captures only a fraction of what the tool can do, and a fraction of very little, multiplied across an entire industry, is not enough to bend a national productivity number.
A handful of patterns tend to separate businesses that have adopted tools from those that have converted them into capability.
Software purchased team by team, with no shared data standard connecting one platform to another
Field data collected diligently but rarely fed back into estimating, planning or design decisions
Training that covers how to log into a system rather than how to use its output to change a call on site
A platform go-live treated internally as the finish line rather than the starting point
These patterns rarely show up in an adoption survey. They only become visible once someone looks at how a business actually works day to day, which is exactly the harder question the next section takes on.
The Integration Problem
The previous section left a question hanging in the air. Digital tools are widespread across Australian construction, yet advanced capability is rare, and productivity keeps falling. The natural next question is whether the industry has a technology problem, where the tools themselves are not yet good enough, or a systems problem, where perfectly good tools are never connected to one another.
The evidence points firmly towards the second explanation. Deloitte’s own capability research found that the median number of separate software systems in use per business has started falling, but a business consolidating six platforms still needs those six platforms to exchange information cleanly, and most don’t.11 Two Australian studies published in 2025 and 2026 went looking for the reason and reached a consistent conclusion. Construction firms are adopting technology in clusters, not as connected systems, and the clusters rarely speak to each other.
Five Application Areas, Working in Isolation
Researchers from the University of Melbourne interviewed directors, managers and innovation officers across Australian construction firms about 14 different digital technologies and where they were actually being used.16 The technologies sorted themselves into five distinct application areas.
Real-time data capture, sensors, drones and site monitoring tools
Digital communication, shared platforms for coordinating between teams
Data analysis, turning captured information into forecasts and reports
Visualisation, including BIM models and digital twins
Off-site construction, prefabrication and modular assembly
A firm typically becomes competent in one or two of these areas and stays there. A contractor might run an excellent drone survey program without that data ever reaching the estimating team. A design office might build a detailed BIM model that construction crews never open on site. Each capability is real. None of them accumulates into the kind of end-to-end digital workflow the term “Construction 4.0” implies. The five areas function less like a connected pipeline and more like five separate departments that happen to sit under the same roof.
What Fragmentation Sounds Like From the Inside
A separate study, based on interviews with 23 Australian construction professionals across engineering, architecture and project management, put numbers and voices to the same pattern.15 One project manager described the potential for far better coordination through the supply chain, then immediately noted it remains largely unrealised because implementation stays siloed rather than shared. Another respondent was blunter about the practical cost. Common data environments already exist on most projects, but different stakeholders still use different tools inside them, which quietly recreates the inefficiency the shared environment was supposed to remove.
The scale of the waste is easy to understate until it is put in front of you. One respondent, reflecting on how little of the data collected on site actually gets used, estimated that close to 90% of it goes nowhere because the people generating it were never shown how to turn it into a decision.15 A drone survey that nobody feeds into a cost model is not a technology failure. The sensor did its job. The gap sits in what happens to the information afterwards, and that gap is organisational, not technical.
It helps to picture a construction site where every trade runs its own services to a high standard. The electrician’s wiring is immaculate, the plumber’s pipework is exact, the data cabling is perfectly terminated, but nobody has connected any of it to a shared switchboard. Walk the site and everything looks finished. Try to turn the lights on and nothing happens, because being present in the same building was never the same as being wired into the same system.
The Missing Layer is Governance
The deeper reason these systems stay disconnected is that almost nobody owns the job of connecting them. The same research identified an absence of national data standards and mandated rules for how Construction 4.0 technologies should be implemented, which leaves each firm to work out interoperability on its own rather than against a shared benchmark.15 The uncertainty gets more serious once data starts crossing organisational boundaries. Respondents pointed to genuine legal uncertainty over who is responsible when a shared model or an automated system gets something wrong, the firm that built the tool, the firm that operates it, or the firm that relied on its output.15
State governments have started filling part of that vacuum. Victoria’s Digital Asset Policy is one of the few Australian frameworks that sets a common standard for how project data should be structured and shared, rather than simply requiring that digital tools be used at all.15 It is a useful start, and on its own, still a state-level answer to a problem that construction experiences at a national and often cross-border scale.
Put together, these findings reframe the productivity puzzle. Construction is not short of digital tools, and the tools available are broadly comparable to what other industries use. The missing piece is the connective layer, shared data standards, clear governance and cross-project interoperability, that turns five well-adopted technologies into one working system. Digitising a fragmented workflow without fixing the fragmentation itself tends to speed up the same problem rather than solve it. The next section finds this same trap waiting inside Australia’s rapid AI adoption.
AI: From Experimentation to Value
Australian construction leaders report using artificial intelligence at a rate few other markets can match. KPMG’s Global Construction Survey found that 43.8% of Australian respondents had adopted AI at scale, against 24% globally.17 Taken alone, the figure suggests the industry has already moved past experimentation. Placed beside two other Australian datasets, it suggests a more measured picture, and the gap between the three numbers says a good deal about how AI adoption should be read.
Three Surveys, Three Answers
The Australian Bureau of Statistics found that 6% of construction businesses used AI in 2024–25, compared with 12% of all Australian businesses.18 Deloitte and Autodesk reported that 52% of the 287 Australian businesses in their 2026 study used AI or machine learning tools.11 KPMG’s 43.8% sits between the two. Each comes from a reputable source, and each answers a different question put to a different group.
| Source | Who was asked | What was counted | Australian result |
|---|---|---|---|
| ABS Business Characteristics Survey, 2024–2518 | Employing businesses of all sizes across the economy, with construction reported as one industry | AI listed among the technologies the business used, with no measure of how heavily | 6% of construction businesses |
| Deloitte and Autodesk, 202611 | 287 Australian architecture, engineering, construction, development and specialty trade businesses | Use of AI or machine learning tools | 52% |
| KPMG Global Construction Survey, 2025/261719 | Senior industry leaders, surveyed between January and March 2025 | AI adopted at scale, which KPMG’s global report benchmarks at AI on more than half of projects | 43.8% |
Before quoting any AI adoption figure, four checks are worth making.
Who was asked, whether all businesses, large firms only or senior leaders
What counts as adoption, whether any use, regular use or use across most projects
How many responded, particularly for a single country inside a global survey
When the survey was fielded, since AI tools have changed quickly between survey rounds
Depending on who is counted, between 6% and 52% of Australian construction firms use AI in some form. The share using it routinely and within clear rules is smaller again, and few surveys measure it.
Where the Industry Sits on the Ladder
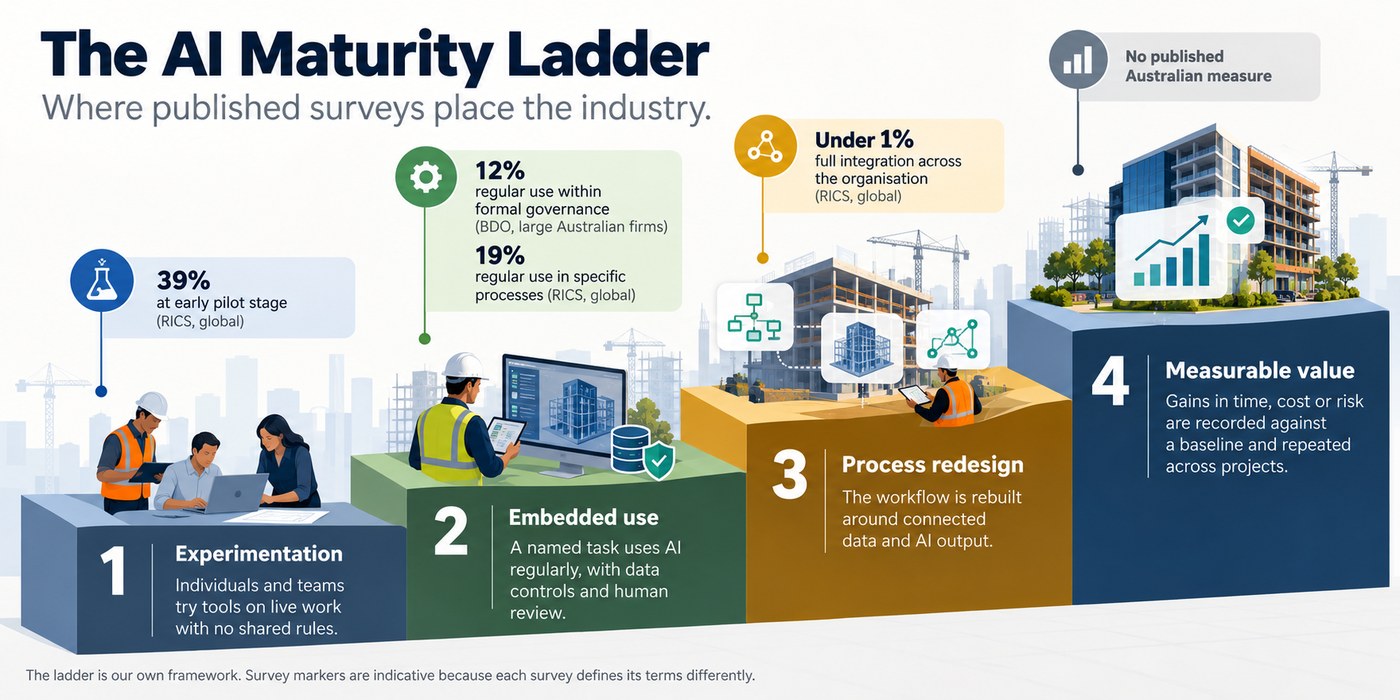
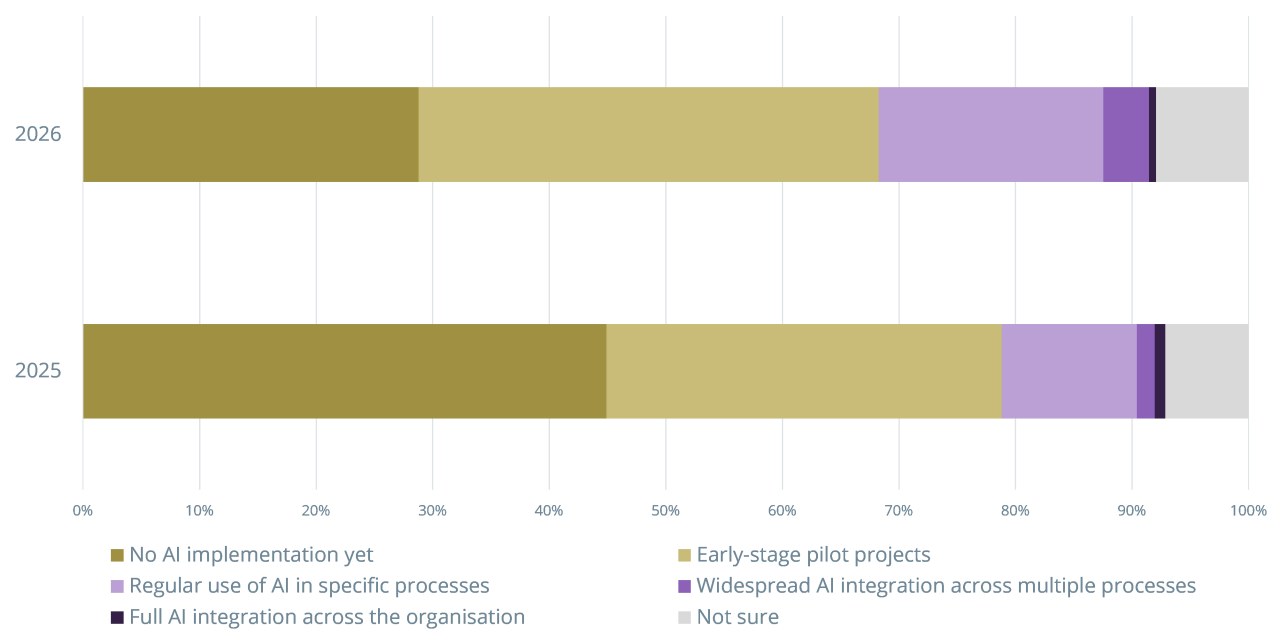
BDO’s 2026 Construction Report, based on large Australian construction organisations, found AI widely adopted but mostly unstructured and experimental, with only 12% of respondents using it regularly inside a formal governance or operating framework.20 RICS tracks the same question globally, and its 2026 survey of 1,883 construction professionals shows a similar shape. About two-thirds now use AI somewhere in their work, up from just over half a year earlier, yet regular use in specific processes stands at 19% and full integration across the organisation at under 1%.21 The most common position remains the early pilot.
We read these numbers through a four-step maturity ladder. Firms begin with experimentation, move to embedded use in specific tasks, then redesign the surrounding process, and finally measure the value returned. Published surveys describe the lower steps reasonably well. The top step is rarely reached in the data, because few surveys ask what AI has returned in money, time or risk.
What AI Is Doing Today, and What Comes Next
The uses that work today involve a narrow task, a document or dataset already in hand, and a person ready to check the result. John Holland shows the pattern. The contractor began with machine learning for invoice processing in 2021, then built a private ChatGPT environment with Microsoft that drew more than 200 unique daily users by March 2024, mostly for writing and summarising.22 Staff may not put company or client data into public AI tools, and every output must pass a human quality check before use.22 Copilot users in the trial estimated savings of 30 to 60 minutes a day, a self-reported figure that still shows where value appears first, in document work where the answer can be checked in seconds.22 KPMG’s global respondents report a similar tilt, with AI adopted for report generation at 47% and for contract administration at 39%.19
Later uses need connected project data and stronger governance. KPMG notes that cost forecasting, equipment optimisation and safety risk prediction demand significant capital, with returns often visible only after several project cycles.19 RICS respondents expect design optioneering to have the greatest impact over five years, with compliance automation among the most selected areas after it.21 Most firms are still building the foundations these uses depend on.
Why Data Decides the Outcome
Site engineers know the rule about setting out. A total station can place a column within a few millimetres of where the model says it belongs, but if the control point it was set up from is wrong, every column lands precisely in the wrong place. AI behaves the same way. Its precision comes from the calculation, and its accuracy depends on the data it was set up from. A firm feeding a model inconsistent cost codes, late site records or drawings of uncertain revision will receive confident answers with the same flaws built in.
RICS found a structural reason construction struggles to move from pilot to routine use. Commercial property and construction both pilot AI at a rate of 39%, yet regular use reaches 29% in property and 19% in construction.21 Property data is held at portfolio level and accumulates across assets, while construction data resets at each project boundary, and project-by-project income forces every AI investment to prove itself on an individual job.21 Infrastructure Australia describes the same project-by-project logic in tendering, where it discourages scalable innovations such as digital engineering.1
Economy-wide data hints at a related imbalance. Between 2021–22 and 2024–25, the share of Australian businesses using AI rose from 1% to 12%, while the share actively collecting or analysing data to make decisions fell from 24% to 10%.18 The ABS redeveloped its survey in this cycle and the figures span every industry, so the size of the fall deserves caution. The direction still raises a fair question for construction, which is whether AI is spreading faster than the data habits that make it useful.
Icon, the commercial builder, shows what a sound data foundation looks like in practice. Its Group Construction and Technology Manager, Dominic Martens, is cited in the 2026 Deloitte and Autodesk report describing a policy of pushing all project data into one environment, so that teams always work from the latest information and site staff can open current drawings straight away.23 The practice concerns data, and a single current source is what any AI tool would need to draw on.
“Australia doesn’t have a technology adoption problem; we have a value realisation problem.”
Oberoi’s remedy is one connected data backbone, closer collaboration and a workforce that can use the tools with confidence.23 The last of those three is where the next constraint appears.
Skills and Judgement Set the Pace
RICS’s 2025 global survey named a lack of skilled personnel as the most cited barrier to AI adoption at 46%, ahead of system integration at 37% and poor data quality at 30%.24 The top three barriers were unchanged in 2026. Concern about implementation cost fell from 29% to 25% as tool prices dropped, while privacy and security concerns rose from 22% to 30%.21 As tools become cheaper, the binding constraint shifts towards people and data.
RICS also flags a risk that suits construction closely. Newly qualified professionals often start using AI before they have the experience to judge its output, and survey respondents voiced concern about uncritical trust in what the tools produce.21 Anil Sawhney of RICS has argued that the sector must focus on “high-quality data, compelling value propositions, organisational readiness and strong leadership”.24 The Australian picture is uneven. Infrastructure Australia’s 2025 survey found that 64% of firms had invested in digitalisation over the past year, spanning BIM, AI, robotics and automation, while 26% had made no investment and small businesses lagged on both adoption and awareness of AI tools.1
Australian construction has moved from asking whether to try AI to asking whether trying has produced anything. Measured by use, the industry looks advanced. Measured by governed, repeatable and evidenced use, most firms are still early. As “we use AI” becomes the answer every bidder gives, the differentiator will be evidence of which process changed, by how much and on which project. Few firms have documented that evidence, and fewer still have set it out in a form a client can absorb within minutes. The next section turns to the people who will generate that evidence and the market structures that decide whether it is rewarded.
Skills, Structure and the Productivity Paradox
Australian construction added labour faster than it added output in 2024–25. Hours worked rose 3.0% while gross value added grew 0.1%, and the ABS put multifactor productivity down 2.8%.13 The ABS ties the extra hours to the labour needed to complete large infrastructure projects, and the flat output to heavy and civil engineering work reaching completion while investment in offices and warehouses eased. Timing explains part of that single year, yet Master Builders Australia counts seven consecutive annual falls in construction multifactor productivity in the ABS series.25 The preceding sections showed technology arriving, and the question of what is still missing starts with people.
Skills Come Before Tools Pay Off
Deloitte’s Capability Index found workforce and skills to be the weakest of its four dimensions across the Asia-Pacific businesses it surveyed.11 Infrastructure Australia describes the workforce task as two jobs at once, which are filling roles that remain in short supply and upskilling existing workers for the digital and net zero transition.1 Researchers at Monash University and the University of Melbourne interviewed 23 Australian professionals, including quantity surveyors, architects, project managers, engineers and academics, and all of them agreed that skills are a precondition for successful implementation. The interviews also describe a training system that has not caught up. Most participants reported little or no organisational support for training in the new technologies, and several taught themselves through online courses and their own research. One interviewee found that data analysis courses were aimed mostly at other sectors such as health, which limited their use on a construction project.15
The skills the interviewees named fall into three groups.
Technical skills, including digital literacy, data analytics, parametric and computational modelling, and 4D modelling for BIM.
Cognitive skills, including adaptability, problem solving and the ability to fit new tools into existing site processes.
Management skills, including information management, requirements management, contract administration, leadership and clear communication.
Investment in those skills varies widely across the industry, and Infrastructure Australia’s 2025 survey shows where the gaps sit. It found that 66% of surveyed organisations had invested in upskilling over the previous 12 months, led by engineers and designers at 85%. Subcontractors invested least, with 33% making no investment against 22% of contractors and consultants, and only a quarter of all organisations planned to raise upskilling spending over the next 12 months. The gap matters because subcontractors deliver 41% of infrastructure construction, so the firms that invest least in skills carry a large share of the physical work.1 KPMG’s survey of senior leaders puts the share of transformation spend going to people at 23.6% in Australia against 21% globally. The Australian figure comes from a national subset of a 375-respondent survey, so we read it as a signal of intent.17 Retention adds pressure, because interviewees in the Monash and Melbourne study described skilled people leaving construction for industries that let them use their technology skills more fully.15
Short, targeted training appears to hold learners better than traditional courses. The TAFE NSW Institute of Applied Technology in Construction delivers short courses in BIM, modern methods of construction, automation and leadership. Infrastructure Australia reports almost 50,000 enrolments across 44 microcredentials and nine microskills, with a course completion rate of 77% against 42% for comparable courses nationally.1 Completion does not prove that practice changed on site, yet it suggests that short, industry-designed courses suit a workforce with little time to spare. The Monash and Melbourne researchers reached a similar view and recommended nationally endorsed micro-credentials in BIM, applied AI and data-driven project management.15
Structure Sets the Ceiling
A firm can train its people well and still meet a limit set by the shape of the industry. CEDA counts 410,602 construction firms in Australia, of which 98.5% employ fewer than 20 people and 91% employ fewer than five, up from 43% in 1988–89. Firms with fewer than 20 employees account for 53% of sector revenue. Using previously unreleased ABS data, CEDA found that firms with 200 or more employees generate 86% more revenue per worker than firms with five to 19 employees, treating revenue per worker as a proxy for labour productivity. If construction matched the size distribution of manufacturing, CEDA estimates it would produce 12% more revenue, about $54 billion a year, without extra labour, which equals roughly 150,000 additional workers.26 The estimate sits close to the 141,000 infrastructure workers that Infrastructure Australia counted as missing in late 2025, although the two figures cover different scopes.1
CEDA links the small scale of most firms to the cycle of demand, since downturns can penalise businesses that hold machinery and technology and so favour flexible labour and subcontracting.26 Subcontracting now delivers 41% of infrastructure construction, and Infrastructure Australia records the costs that follow, including interface risk, weaker self-performance by head contractors and fewer training opportunities for workers.1 A project works like a factory that is built for one order, staffed by a temporary crew and demolished on completion. A manufacturer improves its production line over years because the line stays in place, while a contractor rebuilds the line for every project and loses part of what the last one taught. KPMG’s global survey of 375 leaders found that only 28% of organisations had scaled digital construction solutions across their portfolios, and the report sums up the position in a phrase, “adoption is happening, but impact isn’t.”19
Measurement adds a further limit on what firms can learn from their own projects. Infrastructure Australia reports that only 8% of firms measured rework as part of their productivity metrics in its 2024 survey, and that no consistent project-level data exists on subcontracting or self-performance.1 Without such data, neither firms nor governments can tell which digital practices lift productivity and which only look modern. KPMG Australia sizes the potential prize at $56 billion a year if construction productivity matched the economy-wide average, and it points to fragmented delivery, siloed data and limited technology adoption, particularly among mid-tier contractors.17 We treat the figure as a marker of scale, since KPMG presents it as a potential opportunity.
“The reality is that there’s a significant gap between ambition and execution.”
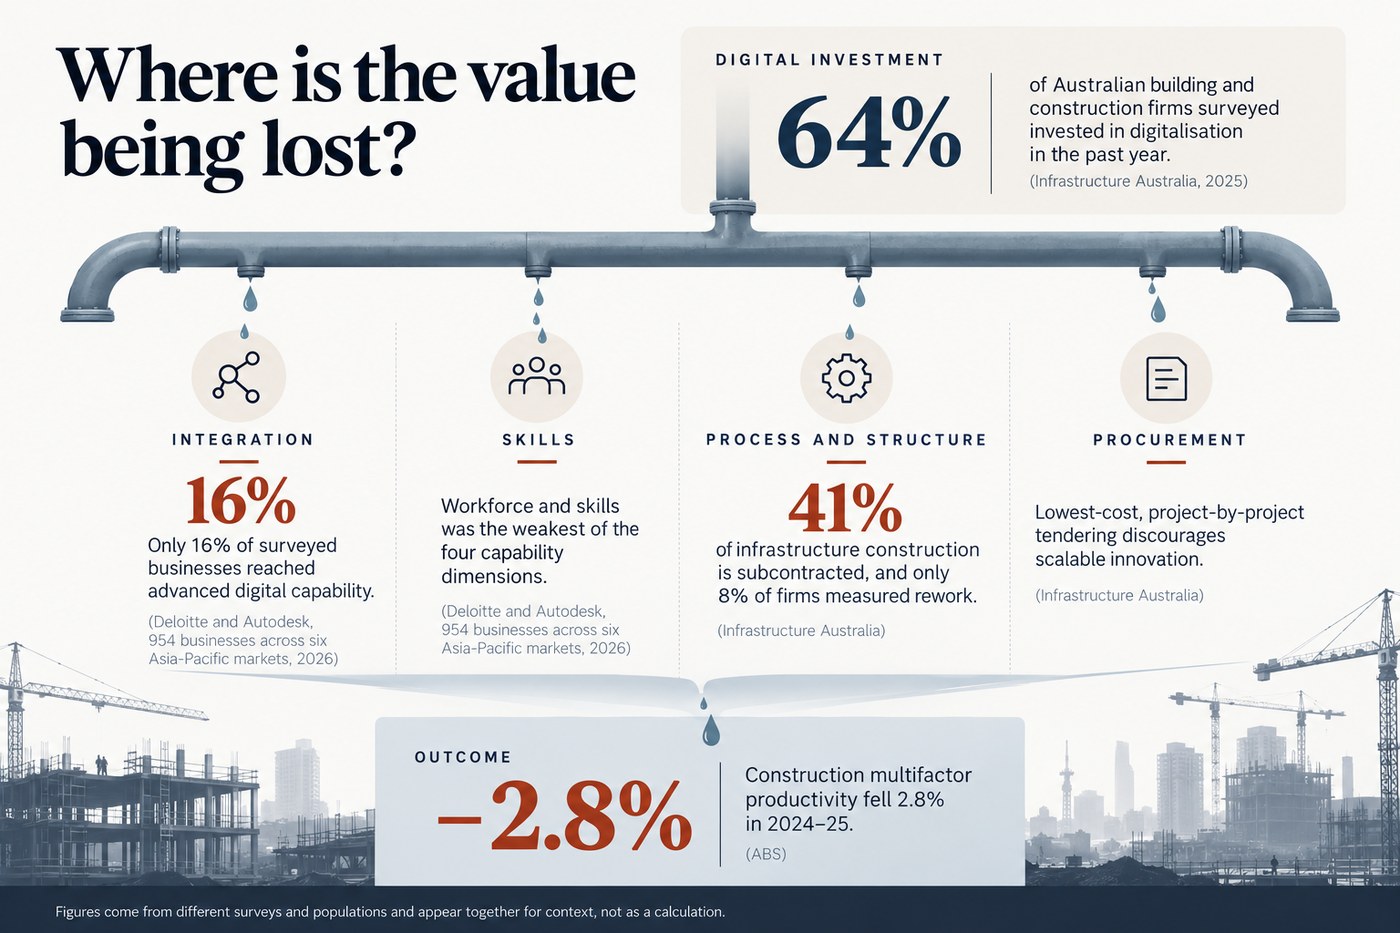
Taken together, the evidence points to four places where digital spending leaks before it reaches productivity. Systems fail to connect, people go untrained for the work, project structures reset learning at each handover, and procurement does not reward the investment. Each leak shows up in a different dataset, which is why no single statistic in this report explains the paradox. A firm can address the first three from the inside, while the fourth depends on clients, which is where the next section goes.
Competing on Capability in a Market That Buys on Price
Firms that fix their skills, systems and structure still have to win work, and the market they win it in is consolidating. Hubexo’s 2026 Construction League shows the top 50 builders starting 722 projects worth a combined $43.9 billion in 2025, a 32% rise in value on a project count that barely moved. The top ten accounted for $22.9 billion of that total, just over half by our calculation, while starting 15% fewer projects than a year earlier.27 The pattern points towards fewer, larger and more complex builds across the sectors the league tracks, which include commercial, community, industrial and multi-residential work.
Larger projects reward firms that can run connected data across many parties, which is the capability Deloitte found in only a minority of businesses. Deloitte associates advanced capability with higher win rates, and the association does not show that capability wins work, since larger and better-capitalised firms may differ in other ways that also help them win.11 CEDA’s finding that revenue per worker rises with firm size points the same way. Scale and capability probably reinforce each other, because bigger firms can spread the cost of platforms and training over more projects, yet none of the studies cited in this report separates cause from effect.
What Leaders Say They Are Competing On
KPMG’s Australian respondents name competition, material and equipment costs and supply chain risk as their most frequent challenges. They rank managing risk more effectively as their top priority, with improving data and technology capabilities second.17 We read digital capability here as a risk instrument as well as an efficiency tool, since a firm that can show live cost, programme and quality data offers clients less uncertainty. The global survey behind those figures found that 75% of 375 leaders were equally or more risk averse than a year earlier, even as 71% expressed optimism about the industry.19 An industry that is optimistic about demand and cautious about risk will lean on what it can already measure, and price is the easiest thing to measure in a tender.
A Tender That Scores Price
Infrastructure Australia states that prevailing procurement models focused on lowest cost discourage innovation that delivers long-term value, and it names digital engineering among the scalable innovations that project-by-project tendering discourages.1 An equipment analogy makes the logic easy to follow. A contractor that builds an integrated digital platform resembles a firm that buys its own crane instead of hiring one for each job. The purchase pays back across dozens of projects, but each tender sees only the price of one, and a competitor that hired its way through the last job can quote lower today.
“…investing in innovation rather than fixating on delivering at the lowest possible cost.”
Australian practitioners describe the same friction from inside contracts. Interviewees in the Monash and Melbourne study said that clients and industry bodies still expect drawings as the contractual deliverable. They added that cost concerns deter clients from backing pilot projects and that firms lack the motivation to invest in capital-intensive technology without mandates. The authors conclude that innovation remains at an early stage largely because clients are reluctant to pilot new technologies.15 The state mandates described earlier in this report set a floor for digital delivery on major public works, and nothing in a floor pays a firm to exceed it.
How the Buying Side Is Starting to Move
Three developments suggest that buyers are beginning to change what they purchase.
The National Construction Industry Forum, which brings together employers, workers and government, endorsed its Blueprint for the Future in September 2025 with nine priority reforms that include risk allocation and skills development.1
In June 2026 the NSW Government announced a Modern Methods of Construction Innovation Facility, to be backed by a two-stage competitive tender for local and international operators, and asked its Infrastructure Coordinator General to develop guidance so that government procurement can better incorporate prefabricated products.29
The National Construction Strategy includes a procurement workstream, led by Victoria’s infrastructure delivery authority, that targets standardised procurement processes and a stronger focus on value for money.30
Leaders expect the change to continue, although the starting point is low. In KPMG’s global survey only 20% of respondents said collaborative contracting and delivery models are standard today, while 56% expect them to become standard within five years. The same report quotes John Murphy, chief executive of the UK contractor J Murphy & Sons, on programmes of work with a five-to-ten-year horizon that are appearing at government level and in regulated utilities. He says longer programmes let suppliers “make the relevant investments.”19 A firm can justify a multi-year capability investment only when it can see multi-year work, which is why the shape of the pipeline matters as much as the price of any single tender.
| Procurement model | How work is awarded | What it rewards |
|---|---|---|
| Lowest-cost, project-by-project tender | Lowest bid on each project | Price on the day, with no credit for capability built across projects |
| Standardised, value-focused procurement | Standardised procurement processes | Value for money |
| Collaborative and outcome-based models | Early contractor involvement, open-book transparency and longer programmes of work | Outcomes, through outcome-based incentives |
Three procurement models, from lowest price to shared value. Sources, Infrastructure Australia,1 the National Construction Strategy procurement workstream30 and the KPMG global survey.19
The evidence supports a cautious reading of the market’s direction. Advanced digital capability is associated with better outcomes and buyers are starting to reshape procurement, yet a tender room still scores mostly what it can compare on a page. Capability that a client cannot see or verify has a limited chance of influencing that score. The final section takes up that visibility problem.
From Capability to Visibility
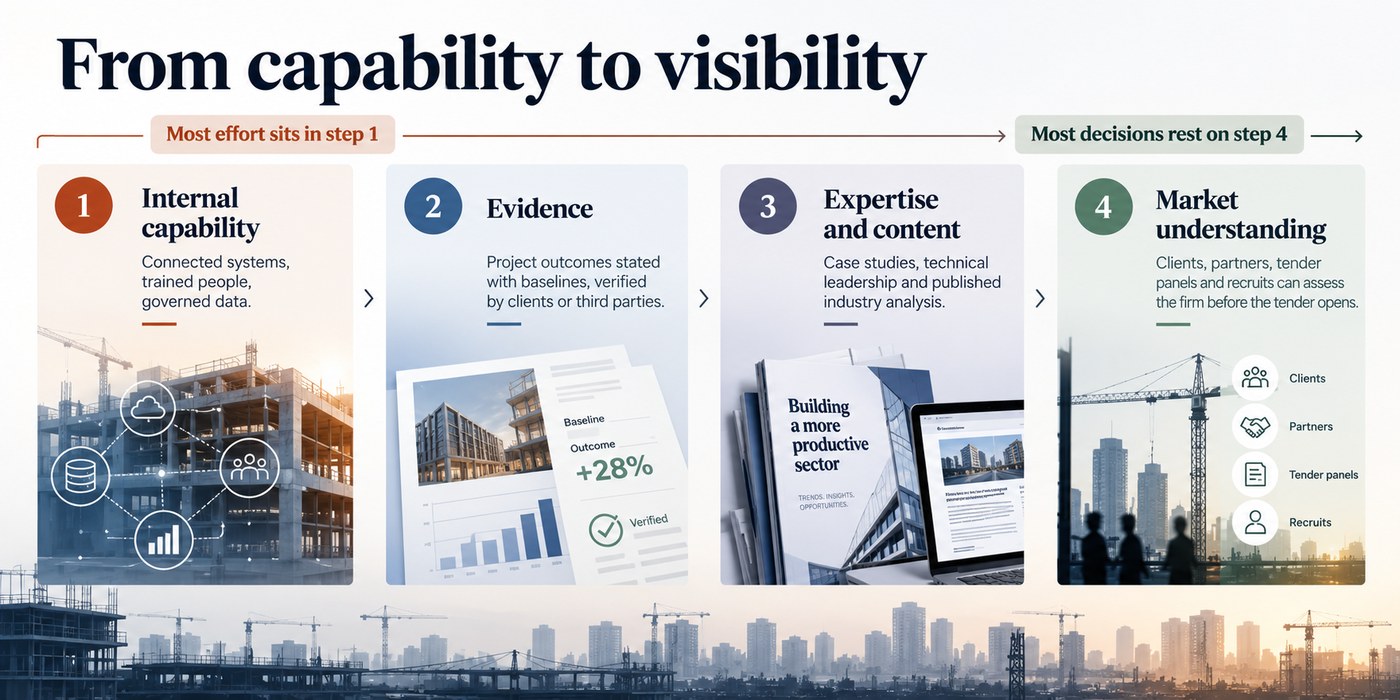
Everything so far describes what happens inside firms and inside the contracts that bind them. Clients, partners, investors and prospective recruits meet only the outputs of those systems, in the form of documents, references and conversations. A building handed over without as-built drawings shows the same problem in miniature, since the work exists and stands up, yet nobody can inspect how it was done. Digital capability that leaves no external record behaves like that building.
How Buyers Now Form a View
McKinsey’s 2026 Global B2B Pulse Survey drew on nearly 4,000 decision-makers across 13 countries, including Australia. Buyers reported using an average of ten channels during a purchase and expecting consistent information across all of them. Inconsistent information across a supplier’s teams was the top reason for switching suppliers, ahead of an inability to reach knowledgeable staff. Generative AI has also entered the top five channels for discovering and evaluating suppliers, alongside supplier websites, in-person interaction, web search and videoconferencing, and McKinsey notes that these tools shape consideration before a sales conversation begins.31 The survey covers B2B buying across many industries, and public tenders follow formal rules that private purchasing does not, so we use it only as a marker of how buyer behaviour is changing.
Construction-specific evidence is older and narrower, and a 2021 study by Malesev and Cherry is the closest fit. The authors interviewed residential construction SMEs and adjacent industry actors. They found widespread recognition that digital marketing has value, alongside weak uptake because of gaps in external analysis and in the investment and training needed to plan and maintain it. Interviewees also described a pervasive attitude that marketing is not core business.32 The constraints of knowledge, skills, investment and planning match the ones that appear throughout this report for operational technology.
Evidence That Travels
The people who score a tender are not always the people who use the technology. Edelman and LinkedIn’s 2025 study of nearly 2,000 professionals calls them hidden buyers, the stakeholders in finance, legal, compliance, procurement or operations who never sign the contract yet influence whether a vendor wins. Among them, 79% said they were more likely to advocate for a proposal during an RFP if the vendor consistently produced high-quality thought leadership. Some 85% prioritised a vendor’s understanding of their business challenges, while only 41% said the safest choice mattered most. In the same study, 81% said high-quality content helps them understand challenges or opportunities they had not recognised, and 51% of the hidden decision-influencers said it helps them persuade senior executives.33 Edelman and LinkedIn both sell communications and marketing services, so we treat the figures as directional.
Evidence of this kind takes specific forms. A case study states the problem, the method and the measured result with a baseline, so a reader can judge scale. A technical leader explains why the firm chose an approach and where it fell short, which shows judgement that a capability statement cannot. Third-party verification such as ratings, certifications and client references travels further than self-description. Published analysis of the delivery problems clients face gives evaluators language and data they can reuse inside their own organisations. Content is the vehicle that carries such evidence out of a firm’s project systems and into the hands of people who never log in to them. The vehicle needs the same disciplines that the rest of this report describes, namely skilled people, consistent data and clear ownership.
A Brazilian contractor offers a concrete case. HTB Engenharia e Construção took part in the EcoVadis sustainability rating, and its Head of ESG, Adriana Nunes Machado, told KPMG that more than 80 clients viewed its results in the first year. She is quite certain that a client would not have awarded HTB a programme to develop 19 airports without seeing its ranking, and she says the transparency “has been paying dividends.”19 The rating measures sustainability performance, and the same mechanism applies to digital capability, since verified evidence reached buyers who could not otherwise inspect the firm.
We leave Construction Leaders With Five Questions
The evidence across this report reduces to five questions. Each can be answered with data a firm already holds or can obtain, and together they test whether investment, capability and market perception are moving in the same direction.
Are you building capability, or buying tools? Infrastructure Australia found that 64% of surveyed firms invested in digitalisation in the past year,1 while Deloitte’s Asia-Pacific sample found that 16% of businesses reached advanced capability.11 The figures come from different surveys, yet both indicate that adoption is running ahead of capability.
Are your systems connected? The five technology application areas described earlier tend to operate in isolation, and a falling count of software systems does not confirm that data moves between them. A useful test asks whether a cost, programme and quality question can be answered from one environment.
Are your people equipped? Workforce and skills was the weakest capability dimension in Deloitte’s index,11 and 33% of subcontractors made no upskilling investment in Infrastructure Australia’s survey.1 A firm can test its position by asking who trained the people who actually use the tools.
Are you measuring business value? Only 8% of firms measured rework in Infrastructure Australia’s 2024 survey,1 and adoption rates and licence counts are far easier to report than on-time delivery, win rates or profit per employee. The outcomes Deloitte associates with advanced capability are the ones worth tracking.11
Can the market see what you are becoming? Buyers now switch suppliers over inconsistent information,31 and evaluators outside the delivery team influence proposal outcomes.33 The question is whether clients, partners and tender panels can read the evidence that the firm’s project systems already hold.
Australian construction has the demand, the technology and a growing body of evidence about what works. The first four questions test what a firm has built, and the fifth tests whether anyone outside the firm can verify it. The firms that pull ahead over the next decade will likely be the ones that answer all five with data, and then publish the evidence in a form that clients and partners can read.